Bevy Procedural Earth Part 3: Visualizations
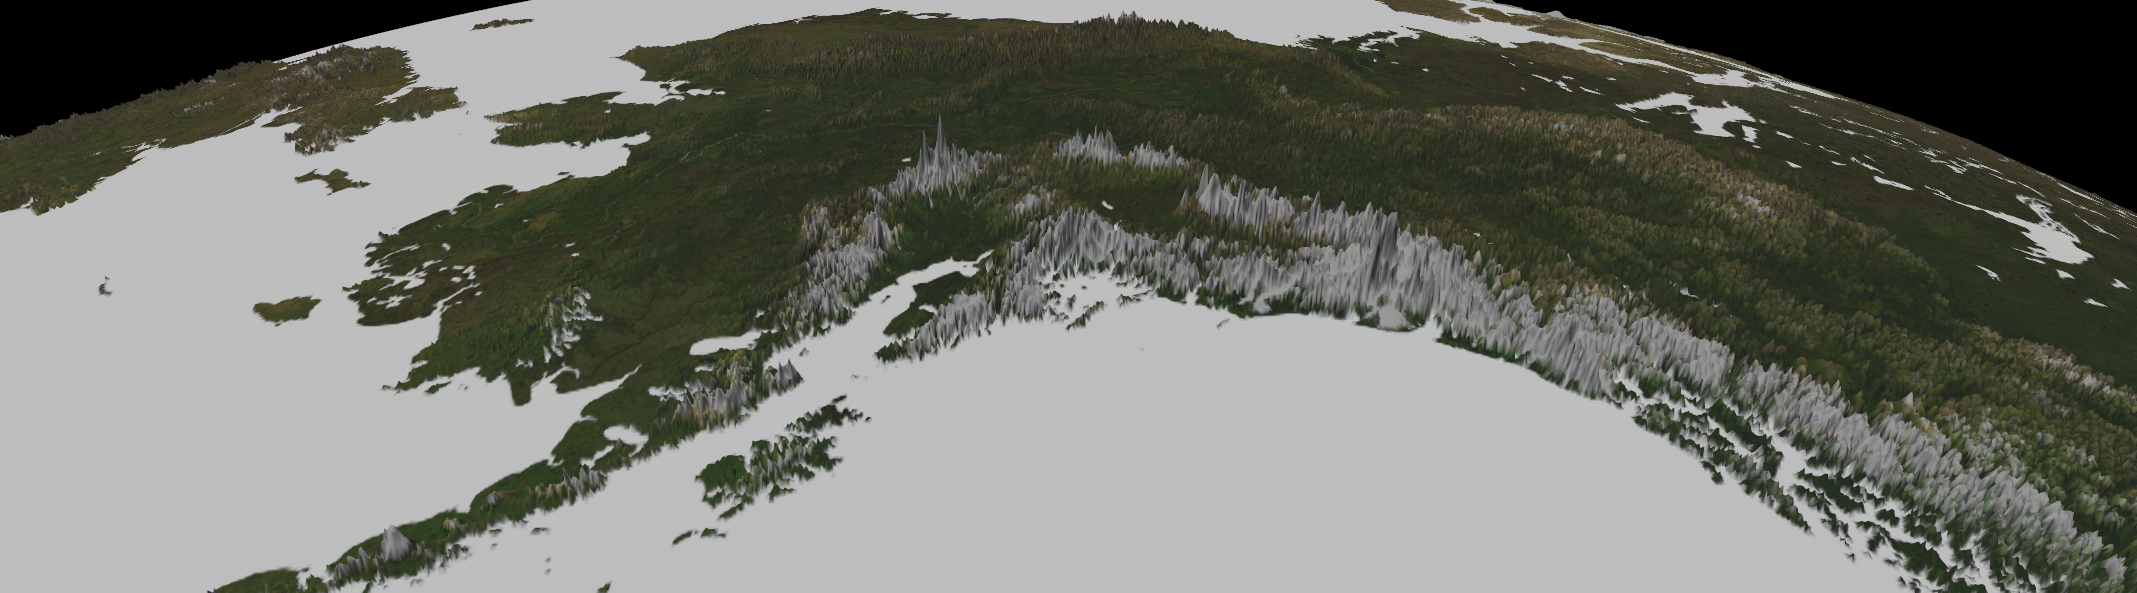
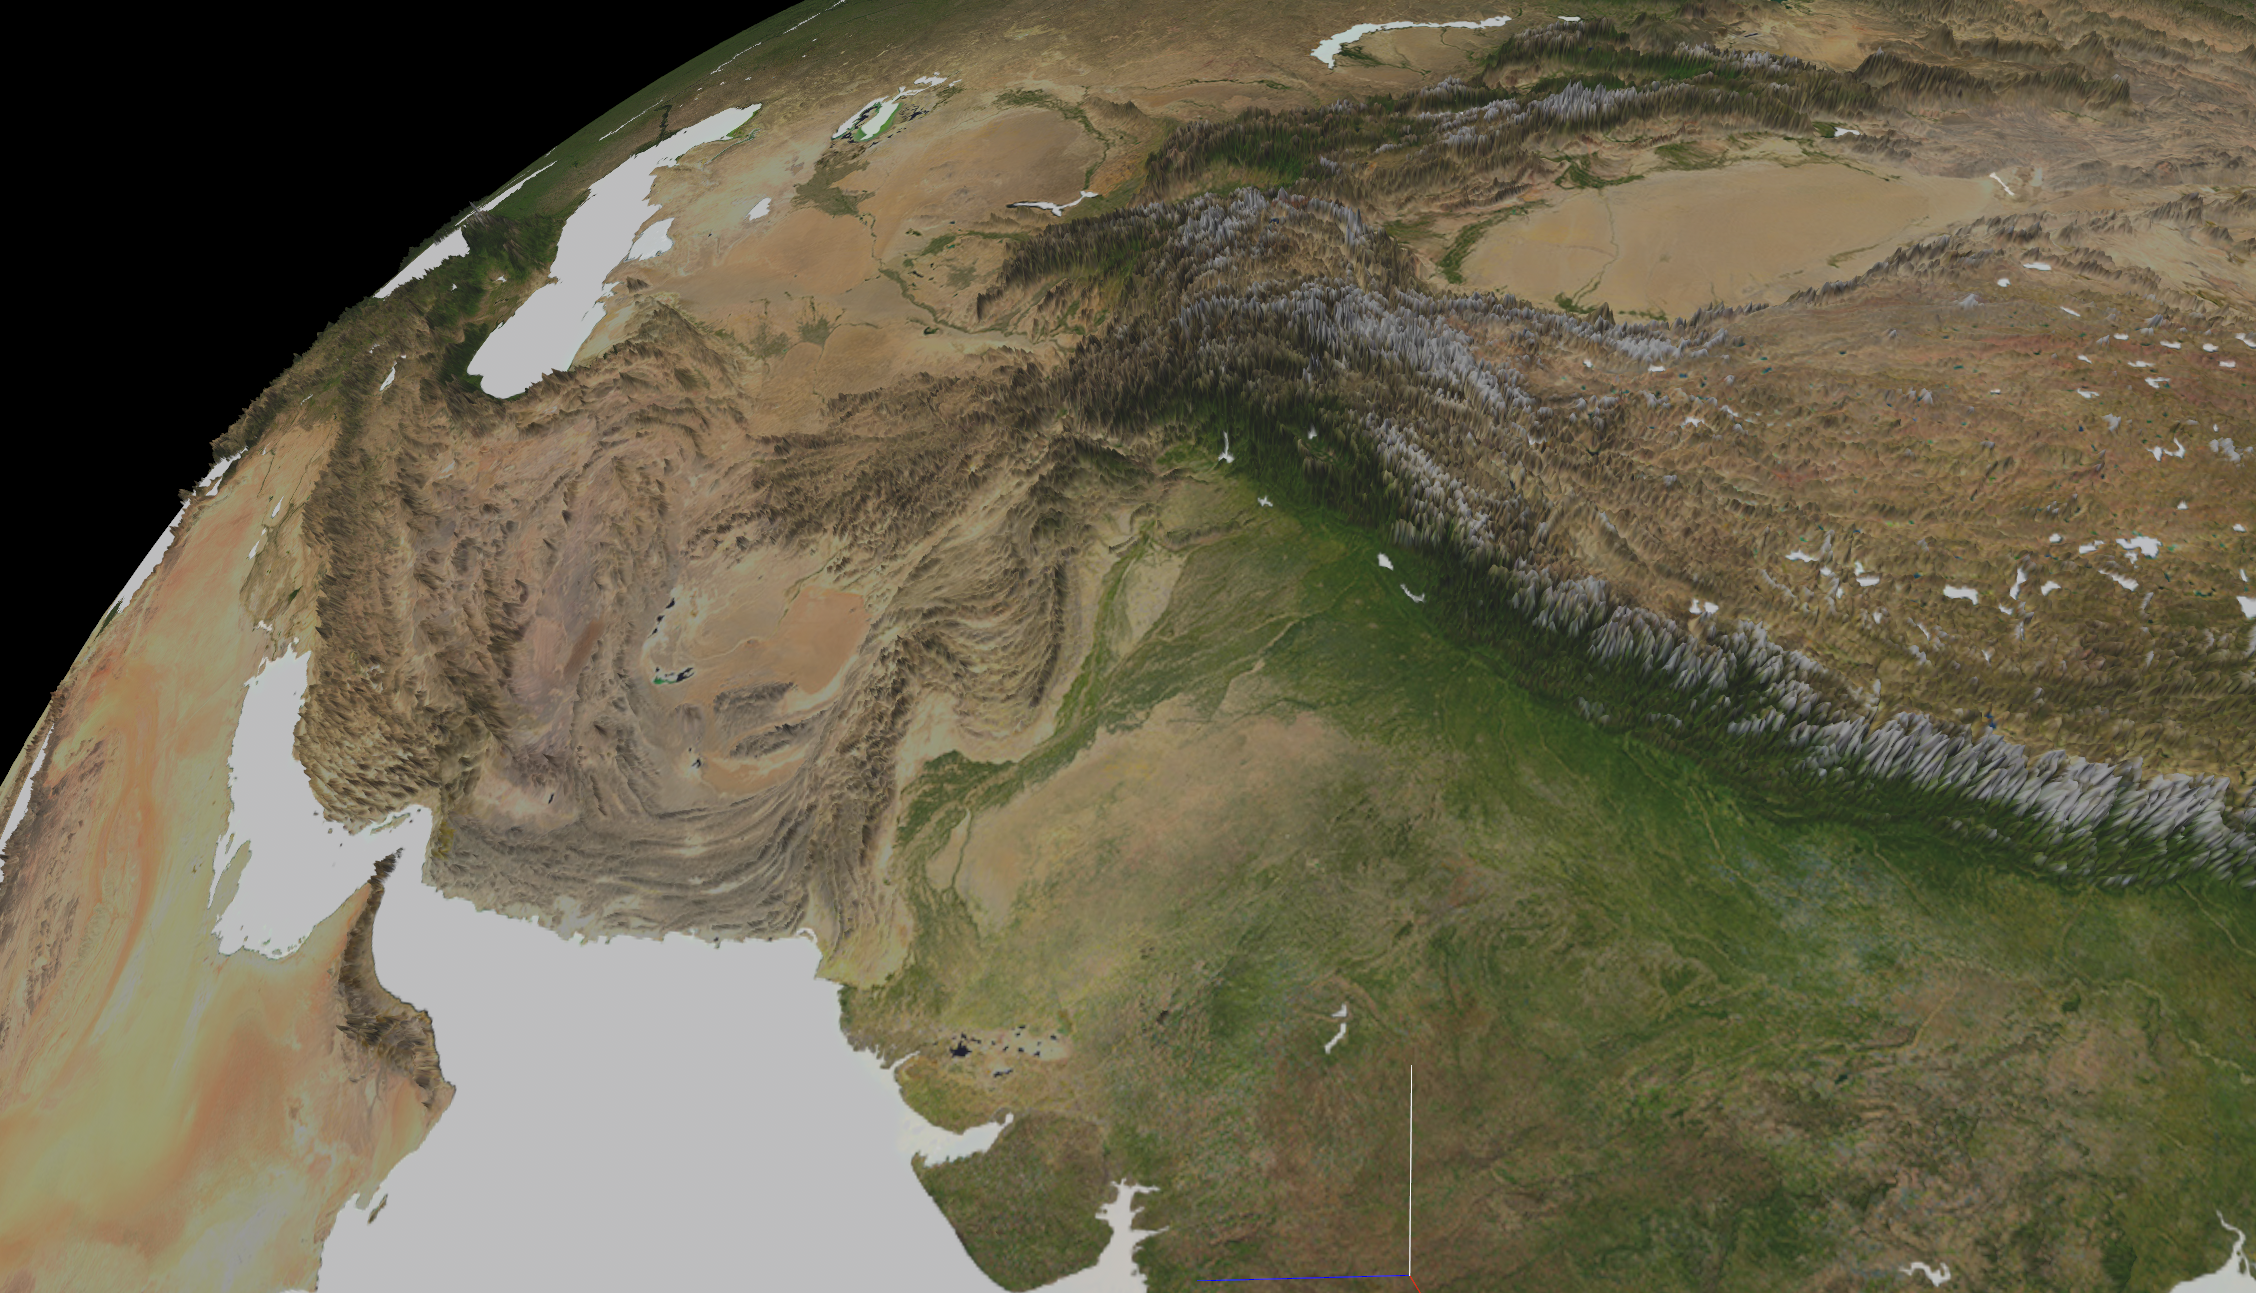
The main goal of this project for me wasn't primarily about game development, but rather just to have a re-usable way to do global visualizations. One of the most interesting things to visualize on a planet is elevation. So in this tutorial we will look at actually displacing vertices in order to give our sphere some depth. This approach utilizes the high vertex count we generated in previous examples to create meaningful terrain detail.
In addition, I'll give an example of how you might use this program to visualize non-elevation data.
Elevation Dataset
I'm using the ETOPO surface elevation models from NOAA in GeoTIFF format at a 60 arcsecond resolution. 60 arcseconds (approximately 1.1 miles at Earth's average surface elevation) is perfectly adequate for what we are doing here. Working with raster files is also nice, because (as discussed in the previous post in this series) we can easily map Latitudes and Longitudes onto the (X, Y) coordinates of our raster using affine transforms (which almost all GIS libraries support).
Reading Data From The Raster
The core functionality is implemented in this struct::
pub struct RasterData {
    pub dataset: Dataset,
    pub transform: CoordTransform,
}

impl RasterData {
    pub fn new(path: &str) -> Result<Self, GdalError> {
        let dataset = Dataset::open(path)?;
        let srs = dataset.spatial_ref()?;
        let target_srs = SpatialRef::from_epsg(4326)?;
        let transform = gdal::spatial_ref::CoordTransform::new(&srs, &target_srs)?;
        Ok(Self { dataset, transform })
    }
    // Takes a latitude and longitude in WGS84 coordinates (EPSG:4326) and returns the elevation at that point
    pub fn get_coordinate_height(
        &self,
        latitude: f64,
        longitude: f64,
    ) -> Result<Option<f64>, GdalError> {
        // Copy the input coordinates
        let (lat, lon) = (latitude, longitude);

        // Transform the coordinates from everyone's favorite datum (WGS84) to the raster's native coordinate system
        self.transform
            .transform_coords(&mut [lon], &mut [lat], &mut [])?;

        // Get the first raster band (usually the only one for elevation data)
        let raster_band = self.dataset.rasterband(1)?;

        // Get the affine transformation parameters that map between pixel/line coordinates and georeferenced coordinates
        let transform = self.dataset.geo_transform().unwrap();

        // Calculate the pixel (x) and line (y) coordinates in the raster using the affine transform
        // transform[0] = top left x coordinate (origin)
        // transform[1] = pixel width (x resolution)
        // transform[3] = top left y coordinate (origin)
        // transform[5] = pixel height (y resolution, typically negative as y decreases going down)
        let x = (lon - transform[0]) / transform[1];
        let y = (lat - transform[3]) / transform[5];

        // Read the elevation value at the calculated pixel position
        // - Reads a 1x1 window at position (x,y)
        // - Uses the Average resampling algorithm (which doesn't matter much for a 1x1 window)
        // - Returns the data as f64 (double precision floating point)
        let mut res_buffer = raster_band.read_as::<f64>(
            (x as isize, y as isize),  // Pixel position (cast to integer)
            (1, 1),                    // Window size to read (1x1 pixel)
            (1, 1),                    // Output buffer size
            Some(ResampleAlg::Average),// Resampling algorithm
        )?;

        // Return the elevation value (or None if no data is found)
        // pop() returns and removes the last element from res_buffer.data
        Ok(res_buffer.data.pop())
    }
}
Here's an example demonstrating how to use this functionality to retrieve elevation data:
#[test]
fn test_raster_map() {
    let raster_data =
        RasterData::new("assets/Bathymetry/gebco_2023_n47.7905_s39.9243_w25.6311_e42.9895.tif")
            .unwrap();

    // Mt Elbrus
    let tgt_latitude = 43.351851;
    let tgt_longitude = 42.4368771;

    let elevation = raster_data
        .get_coordinate_height(tgt_latitude, tgt_longitude)
        .unwrap()
        .unwrap();

    assert_eq!(elevation, 5392.0);
}
And that is basically all there is to extracting data from a raster. If you want to be more precise, it might be useful to calculate the average area represented by each vertex and sample a larger size, averaging the result (which you can adjust by changing the window size) or using a different resampling technique. But since our goal isn't to create ultra-accurate maps I think this should be good enough.
Moving Pixels
Now, I first want to say, this is an extremely unoptimized naive way to do this. If I had more time to dedicate to this little experiment, I would probably split the rendering of each tile (since we constructed our sphere from multiple distinct Entities) into multiple systems so it can generate the offsets in paralell. But perfect is the enemy of done, so here is something that at least works.
Modifying our pre-existing generate_face function, we can accomplish what we need to do with two additional lines:
pub fn generate_face(
    normal: Vec3,
    resolution: u32,
    x_offset: f32,
    y_offset: f32,
    rs: &RasterData,
) -> Mesh {
    let axis_a = Vec3::new(normal.y, normal.z, normal.x); // Horizontal
    let axis_b = axis_a.cross(normal); // Vertical

    // Create a vec of verticies and indicies
    let mut verticies: Vec<Vec3> = Vec::new();
    let mut uvs = Vec::new();
    let mut indicies: Vec<u32> = Vec::new();
    let mut normals = Vec::new();
    let mut first_longitude = 0.0;
    for y in 0..(resolution) {
        for x in 0..(resolution) {
            let i = x + y * resolution;

            let percent = Vec2::new(x as f32, y as f32) / (resolution - 1) as f32;
            let point_on_unit_cube =
                normal + (percent.x - x_offset) * axis_a + (percent.y - y_offset) * axis_b;
            let point_coords: Coordinates = point_on_unit_cube.normalize().into();
            let (lat, lon) = point_coords.as_degrees();
            // Get the height value at the geographic coordinates
            let height_offset = rs.get_coordinate_height(lat as f64, lon as f64);
            // Add the elevation to the earth_radius value of the normalized point
            let normalized_point = if let Ok(Some(offset)) = height_offset {
                let height = if offset > 0.0 { offset / 1000.0 } else { 0.0 };
                point_on_unit_cube.normalize() * (EARTH_RADIUS + (height) as f32)
            } else {
                point_on_unit_cube.normalize() * EARTH_RADIUS
            };

            verticies.push(normalized_point);
            let (mut u, v) = point_coords.convert_to_uv_mercator();

            if y == 0 && x == 0 {
                first_longitude = lon;
            }
            // In the middle latitudes, if we start on a negative longitude but then wind up crossing to a positive longitude, set u to 0.0 to prevent a seam
            if first_longitude < 0.0 && lon > 0.0 && lat < 89.0 && lat > -89.0 {
                u = 0.0;
            }
            // If we are below -40 degrees latitude and the tile starts at 180 degrees, set u to 0.0 to prevent a seam
            if x == 0 && lon == 180.0 && lat < -40.0 {
                u = 0.0;
            }
            uvs.push([u, v]);
            normals.push(-point_on_unit_cube.normalize());

            if x != resolution - 1 && y != resolution - 1 {
                // First triangle
                indicies.push(i);
                indicies.push(i + resolution);
                indicies.push(i + resolution + 1);

                // Second triangle
                indicies.push(i);
                indicies.push(i + resolution + 1);
                indicies.push(i + 1);
            }
        }
    }
    let indicies = mesh::Indices::U32(indicies);
    let mut mesh = Mesh::new(PrimitiveTopology::TriangleList);
    mesh.set_indices(Some(indicies));
    mesh.insert_attribute(Mesh::ATTRIBUTE_POSITION, verticies);
    mesh.insert_attribute(Mesh::ATTRIBUTE_NORMAL, normals);
    mesh.insert_attribute(Mesh::ATTRIBUTE_UV_0, uvs);
    mesh.generate_tangents().unwrap();
    mesh
}
Specifically, the lines we added:
// Get the height value at the geographic coordinates
lvet height_offset = rs.get_coordinate_height(lat as f64, lon as f64);
// Add the elevation to the earth_radius value of the normalized point
let normalized_point = if let Ok(Some(offset)) = height_offset {
    let height = if offset > 0.0 { offset / 1000.0 } else { 0.0 };
    point_on_unit_cube.normalize() * (EARTH_RADIUS + (height) as f32)
} else {
    point_on_unit_cube.normalize() * EARTH_RADIUS
};
As you can see, this is pretty simple since it just builds off of what we already have. You can change the number that divides the offset to adjust how exaggerated the values are. If EARTH_RADIUS is the radius of the earth in meters, a value of 1.0 should give you a perfectly proportional earth. Of course, you won't move each vertex much at all at that point, and with the number of vertices in the sphere, you wouldn't be able to see anything anyways.
Visualizing Other Data
Assuming you want to visualize using new entities, you can easily do so as long as you have a value you want to base the color/shape/size of the new entity on, and the latitude and longitude of the datapoint by converting the LatLon to a Vec3 of a point on the sphere. Here is the struct I use to do all my Geographic/Cartesian coordinate conversions for reference:
#[derive(Debug)]
pub struct Coordinates {
    // Stored internally in radians (because math)
    pub latitude: f32,
    pub longitude: f32,
}

impl From<Vec3> for Coordinates {
    fn from(value: Vec3) -> Self {
        let normalized_point = value.normalize();
        let latitude = normalized_point.y.asin();
        let longitude = normalized_point.x.atan2(normalized_point.z);
        Coordinates {
            latitude,
            longitude,
        }
    }
}

impl Coordinates {
    pub fn as_degrees(&self) -> (f32, f32) {
        let latitude = self.latitude * (180.0 / PI);
        let longitude = self.longitude * (180.0 / PI);
        (latitude, longitude)
    }

    pub fn convert_to_uv_mercator(&self) -> (f32, f32) {
        let (lat, lon) = self.as_degrees();
        let v = map_latitude(lat).unwrap();
        let u = map_longitude(lon).unwrap();
        (u, v)
    }

    #[allow(dead_code)]
    pub fn from_degrees(latitude: f32, longitude: f32) -> Result<Self, CoordError> {
        if !(-90.0..=90.0).contains(&latitude) {
            return Err(CoordError {
                msg: "Invalid latitude: {lat:?}".to_string(),
            });
        }
        if !(-180.0..=180.0).contains(&longitude) {
            return Err(CoordError {
                msg: "Invalid longitude: {lon:?}".to_string(),
            });
        }
        let latitude = latitude / (180.0 / PI);
        let longitude = longitude / (180.0 / PI);
        Ok(Coordinates {
            latitude,
            longitude,
        })
    }

    pub fn get_point_on_sphere(&self) -> Vec3 {
        let y = self.latitude.sin();
        let r = self.latitude.cos();
        let x = self.longitude.sin() * r;
        let z = self.longitude.cos() * r;
        Vec3::new(x, y, z).normalize() * EARTH_RADIUS
    }
}
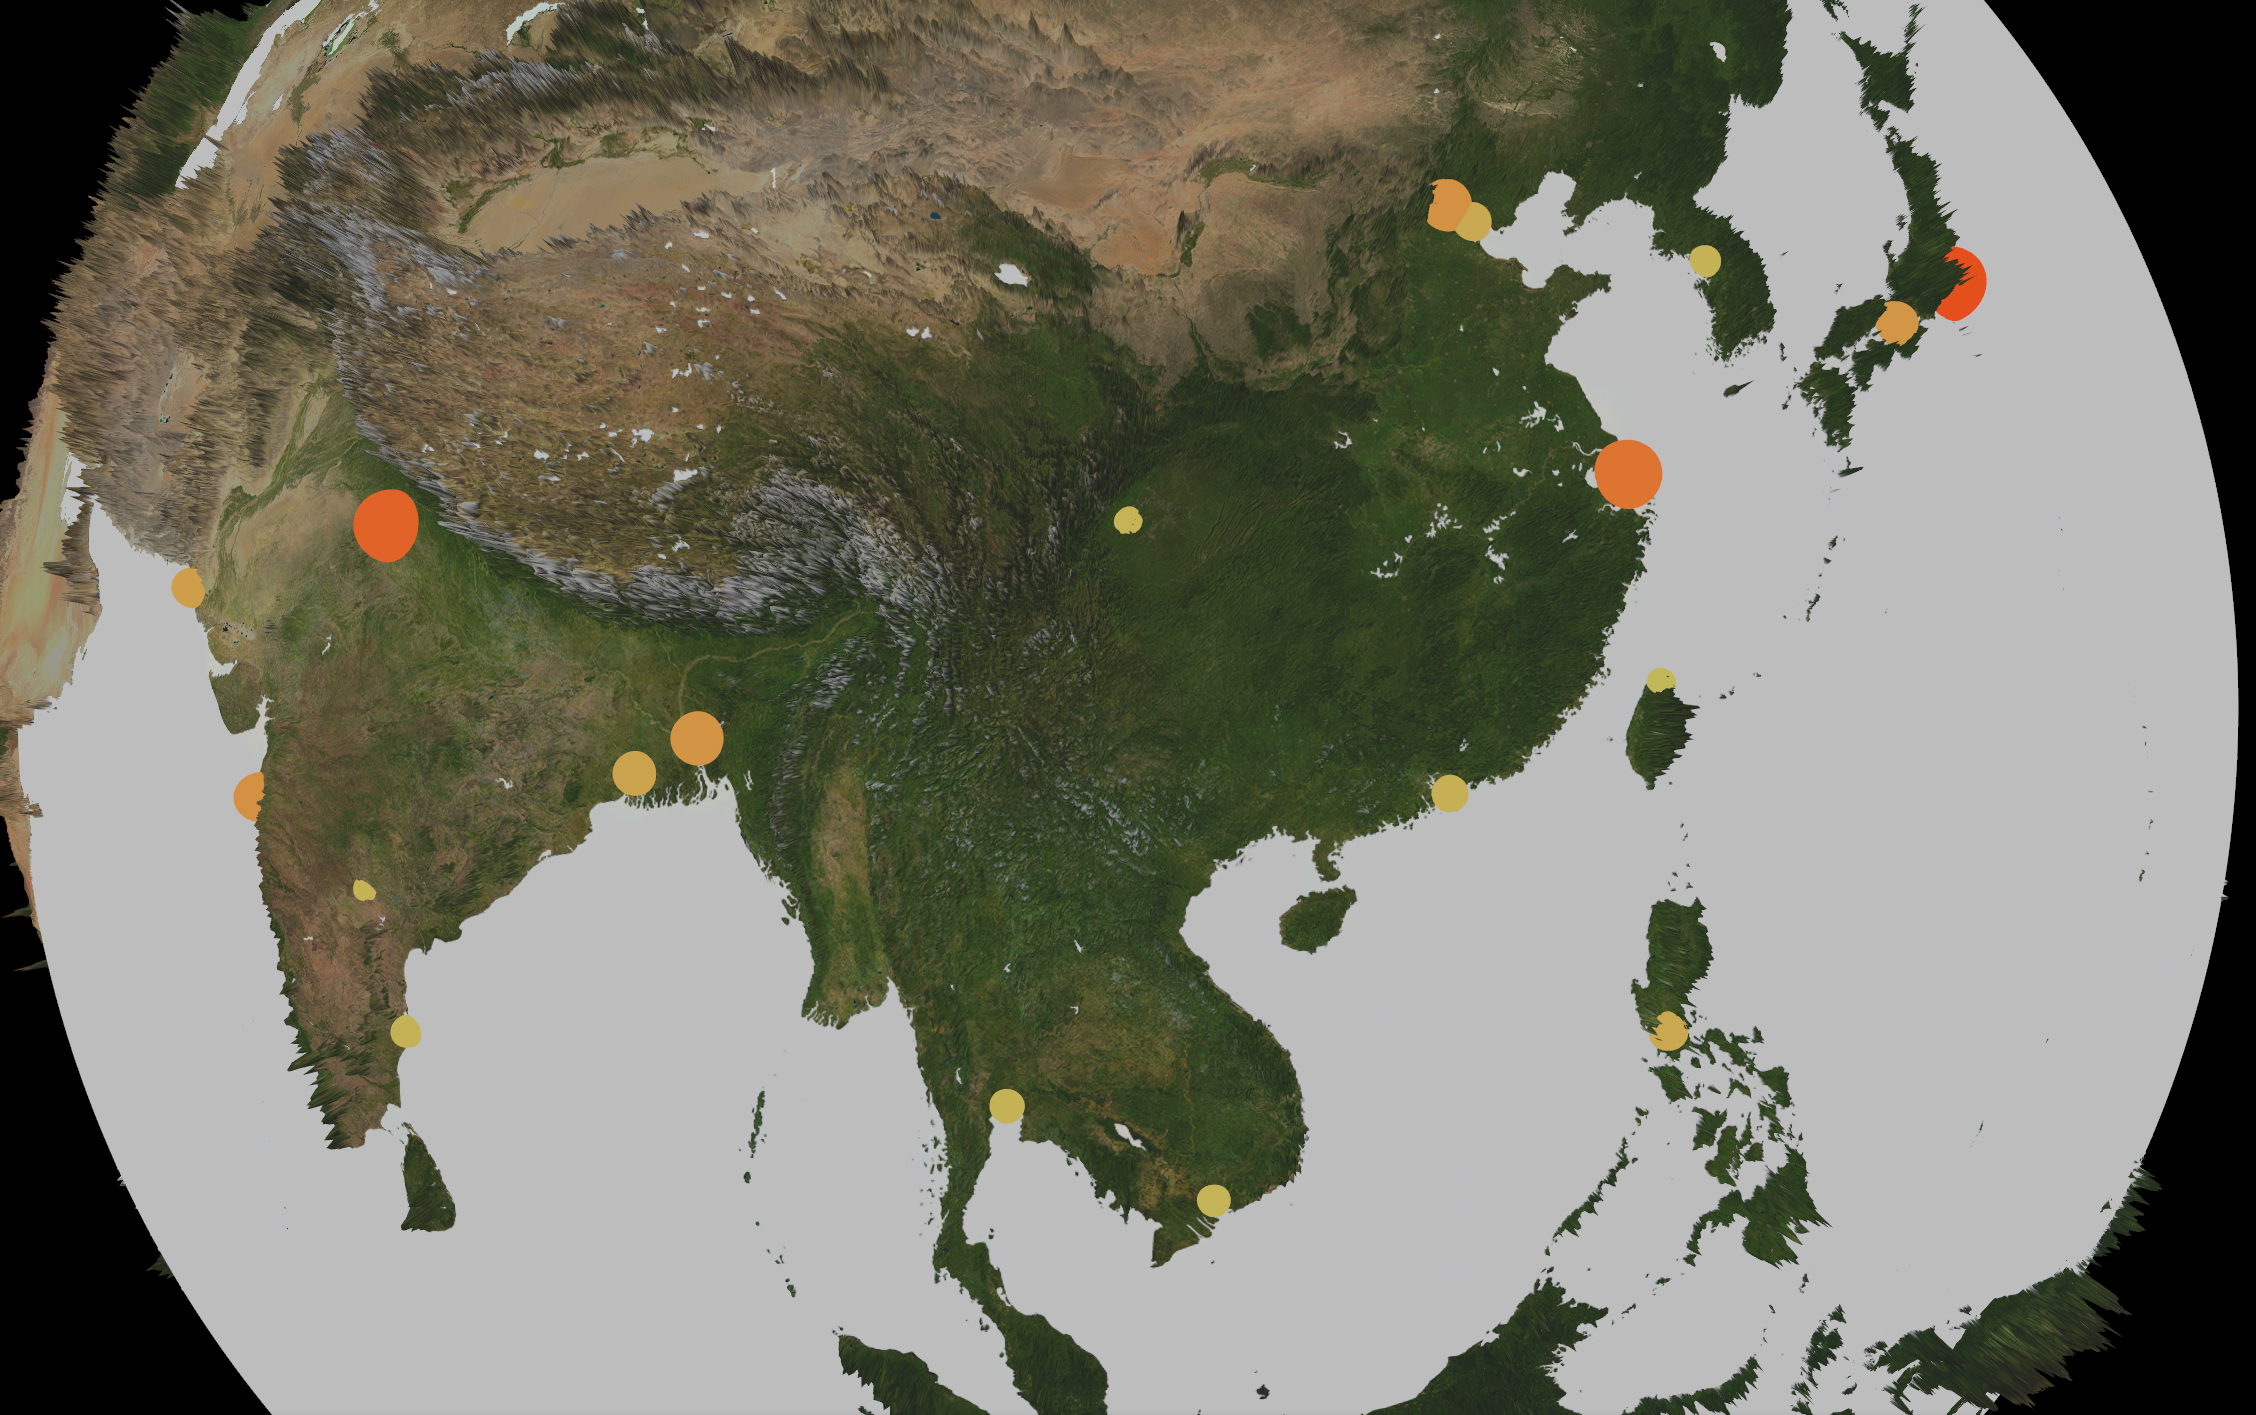
So if we wanted to visualize cities with a population over 1 million as spheres, colored and sized based on total population, we could implement a system like this:
fn spawn_city_population_spheres(
    mut commands: Commands,
    mut meshes: ResMut<Assets<Mesh>>,
    mut materials: ResMut<Assets<StandardMaterial>>,
) {
    // Cities data: (name, latitude, longitude, population in millions)
    let major_cities: Vec<(String, f32, f32, f32)> = vec![
        (String::from("Tokyo"), 35.6762, 139.6503, 37.4),
        (String::from("Delhi"), 28.6139, 77.2090, 32.9),
        (String::from("Shanghai"), 31.2304, 121.4737, 28.5),
        (String::from("São Paulo"), -23.5505, -46.6333, 22.4),
        (String::from("Mexico City"), 19.4326, -99.1332, 22.2),
        (String::from("Cairo"), 30.0444, 31.2357, 21.3),
        (String::from("Mumbai"), 19.0760, 72.8777, 20.7),
        (String::from("Beijing"), 39.9042, 116.4074, 20.5),
        (String::from("Dhaka"), 23.8103, 90.4125, 19.6),
        (String::from("Osaka"), 34.6937, 135.5023, 19.2),
        (String::from("New York"), 40.7128, -74.0060, 18.8),
        (String::from("Karachi"), 24.8607, 67.0011, 16.5),
        (String::from("Buenos Aires"), -34.6037, -58.3816, 15.2),
        (String::from("Istanbul"), 41.0082, 28.9784, 15.1),
        (String::from("Kolkata"), 22.5726, 88.3639, 14.9),
        (String::from("Lagos"), 6.5244, 3.3792, 14.8),
        (String::from("London"), 51.5074, -0.1278, 14.3),
        (String::from("Los Angeles"), 34.0522, -118.2437, 13.2),
        (String::from("Manila"), 14.5995, 120.9842, 13.1),
        (String::from("Rio de Janeiro"), -22.9068, -43.1729, 13.0),
        (String::from("Tianjin"), 39.3434, 117.3616, 12.8),
        (String::from("Kinshasa"), -4.4419, 15.2663, 12.6),
        (String::from("Paris"), 48.8566, 2.3522, 11.1),
        (String::from("Shenzhen"), 22.5431, 114.0579, 10.6),
        (String::from("Jakarta"), -6.2088, 106.8456, 10.6),
        (String::from("Bangalore"), 12.9716, 77.5946, 10.5),
        (String::from("Moscow"), 55.7558, 37.6173, 10.5),
        (String::from("Chennai"), 13.0827, 80.2707, 10.0),
        (String::from("Lima"), -12.0464, -77.0428, 9.7),
        (String::from("Bangkok"), 13.7563, 100.5018, 9.6),
        (String::from("Seoul"), 37.5665, 126.9780, 9.5),
        (String::from("Hyderabad"), 17.3850, 78.4867, 9.5),
        (String::from("Chengdu"), 30.5728, 104.0668, 9.3),
        (String::from("Singapore"), 1.3521, 103.8198, 5.7),
        (String::from("Ho Chi Minh City"), 10.8231, 106.6297, 9.1),
        (String::from("Toronto"), 43.6532, -79.3832, 6.4),
        (String::from("Sydney"), -33.8688, 151.2093, 5.3),
        (String::from("Johannesburg"), -26.2041, 28.0473, 5.9),
        (String::from("Chicago"), 41.8781, -87.6298, 8.9),
        (String::from("Taipei"), 25.0330, 121.5654, 7.4),
    ];

    // Define constants for scaling the spheres
    const BASE_RADIUS: f32 = 2.0; // Minimum radius for smallest city
    const SCALE_FACTOR: f32 = 0.5; // Multiplier for population to radius conversion
    const MIN_POPULATION: f32 = 5.0; // For normalization purposes
    const MAX_POPULATION: f32 = 40.0; // For normalization purposes

    // Create a component to store city information.
    // Not used in this example, but could be used for a tooltip or similar.
    #[derive(Component)]
    struct CityMarker {
        name: String,
        population: f32,
    }

    // Create a mesh that will be reused for all cities
    let sphere_mesh = meshes.add(
        Mesh::try_from(shape::Icosphere {
            radius: 1.0, // We'll scale this in the transform
            subdivisions: 32,
        })
        .unwrap(),
    );

    // Spawn a sphere for each city
    for (name, latitude, longitude, population) in major_cities {
        // Convert latitude and longitude to 3D coordinates on the sphere
        let coords = Coordinates::from_degrees(latitude, longitude)
            .unwrap()
            .get_point_on_sphere();

        // Calculate sphere size based on population
        // Using a logarithmic scale to prevent extremely large cities from dominating
        let normalized_population =
            (population - MIN_POPULATION) / (MAX_POPULATION - MIN_POPULATION);
        let size = BASE_RADIUS + (normalized_population * SCALE_FACTOR * 10.0);

        // Calculate color based on population (gradient from yellow to red)
        let t = normalized_population.clamp(0.0, 1.0);
        let color = Color::rgb(
            1.0,             // Red stays at 1.0
            1.0 - (t * 0.7), // Green decreases with population
            0.5 - (t * 0.4), // Blue decreases with population
        );

        // Spawn the city sphere
        commands.spawn((
            PbrBundle {
                mesh: sphere_mesh.clone(),
                material: materials.add(StandardMaterial {
                    base_color: color,
                    unlit: true,
                    ..default()
                }),
                transform: Transform::from_translation(Vec3::new(coords.x, coords.y, coords.z))
                    .with_scale(Vec3::splat(size)),
                ..default()
            },
            CityMarker { name, population },
        ));
    }
}
Which will render a lovely scaled and colored sphere on each of our coordinates.
In closing, I hope this is informative. I'd like to eventually make this a bit more general and re-usable. Perhaps releasing it as a library or as a WASM app in the future. Building this was an incredible learning experience though. I was a complete newbie to GIS concepts before this. And knowing how to read from Geographic raster files is an incredibly useful thing that can be utilized in lots of different software engineering domains.